Cardinal Chart PCF for Canvas Apps and Custom Pages
Practical setup guide for a Power Apps PCF chart control with JSON modes, duplicate handling, and Power Fx event integration.
Harllens George | 2026-02-15
Cardinal Chart is a Microsoft Power Platform component built with the Power Apps Component Framework (PCF). It renders an XY curve from JSON, with predictable ordering rules, duplicate handling, and clean Power Fx integration for hover and selection.
It is built for real delivery scenarios where charts must behave consistently across Canvas Apps and Custom Pages.
What this component is
This is a reusable PCF chart component for Power Apps teams that need a lightweight XY curve control with clear JSON contracts and predictable behavior in app logic.
Who it is for
- Power Platform developers building Canvas Apps and Custom Pages
- Teams shipping PCF controls with documented JSON contracts
- Consultants and internal product teams that need stable chart behavior in delivery work
Get it
- GitHub repository: Just-Boring-Cat/cardinal-chart-pcf
- PCF Gallery listing:
https://pcf.gallery/(guide will be updated when the listing is live)
Compatibility
- Microsoft Power Platform, Power Apps Canvas Apps, and Custom Pages
- JSON input via
seriesJsonwith Power Fx for binding and event handling - Practical default render limit starts at
maxPointsToRender = 2000for safe app behavior
Common use cases
- Trend lines and KPIs where point order matters
- Time series where duplicates must be allowed or rejected on purpose
- Interactive charts where selecting a point drives app logic (filters, details, navigation)
Quick start
- Add the control to a Canvas App or Custom Page.
- Bind
seriesJsonto compact JSON text. - Start with safe defaults:
orderingMode = "input_order"duplicatePolicy = "allow"hoverValueLabelEnabled = trueshowPoints = truemaxPointsToRender = 2000
- Wire component actions:
onHoverChangedonSelectionChanged
Basic JSON (array)
[
  { "x": 0, "y": 1.23, "label": "Start" },
  { "x": 1, "y": 1.1 }
]
Advanced JSON (object)
{
  "mode": "x_ascending_unique",
  "duplicatePolicy": "error",
  "points": [
    { "x": 1, "y": 1.1 },
    { "x": 0, "y": 1.23 }
  ]
}
Notes:
modeandduplicatePolicyinside JSON override the component properties.- Legacy
tis supported as an alias forx.
Power Fx example
Set(
  varSeriesJson,
  JSON(
    {
      mode: "x_ascending",
      duplicatePolicy: "keep_last",
      points: Table(
        { x: 1, y: 1.23, label: "Start" },
        { x: 1, y: 1.10, label: "Adjusted" },
        { x: 2, y: 1.44 }
      )
    },
    JSONFormat.Compact
  )
);
Ordering modes and duplicates
| Mode | What it does |
|---|---|
input_order |
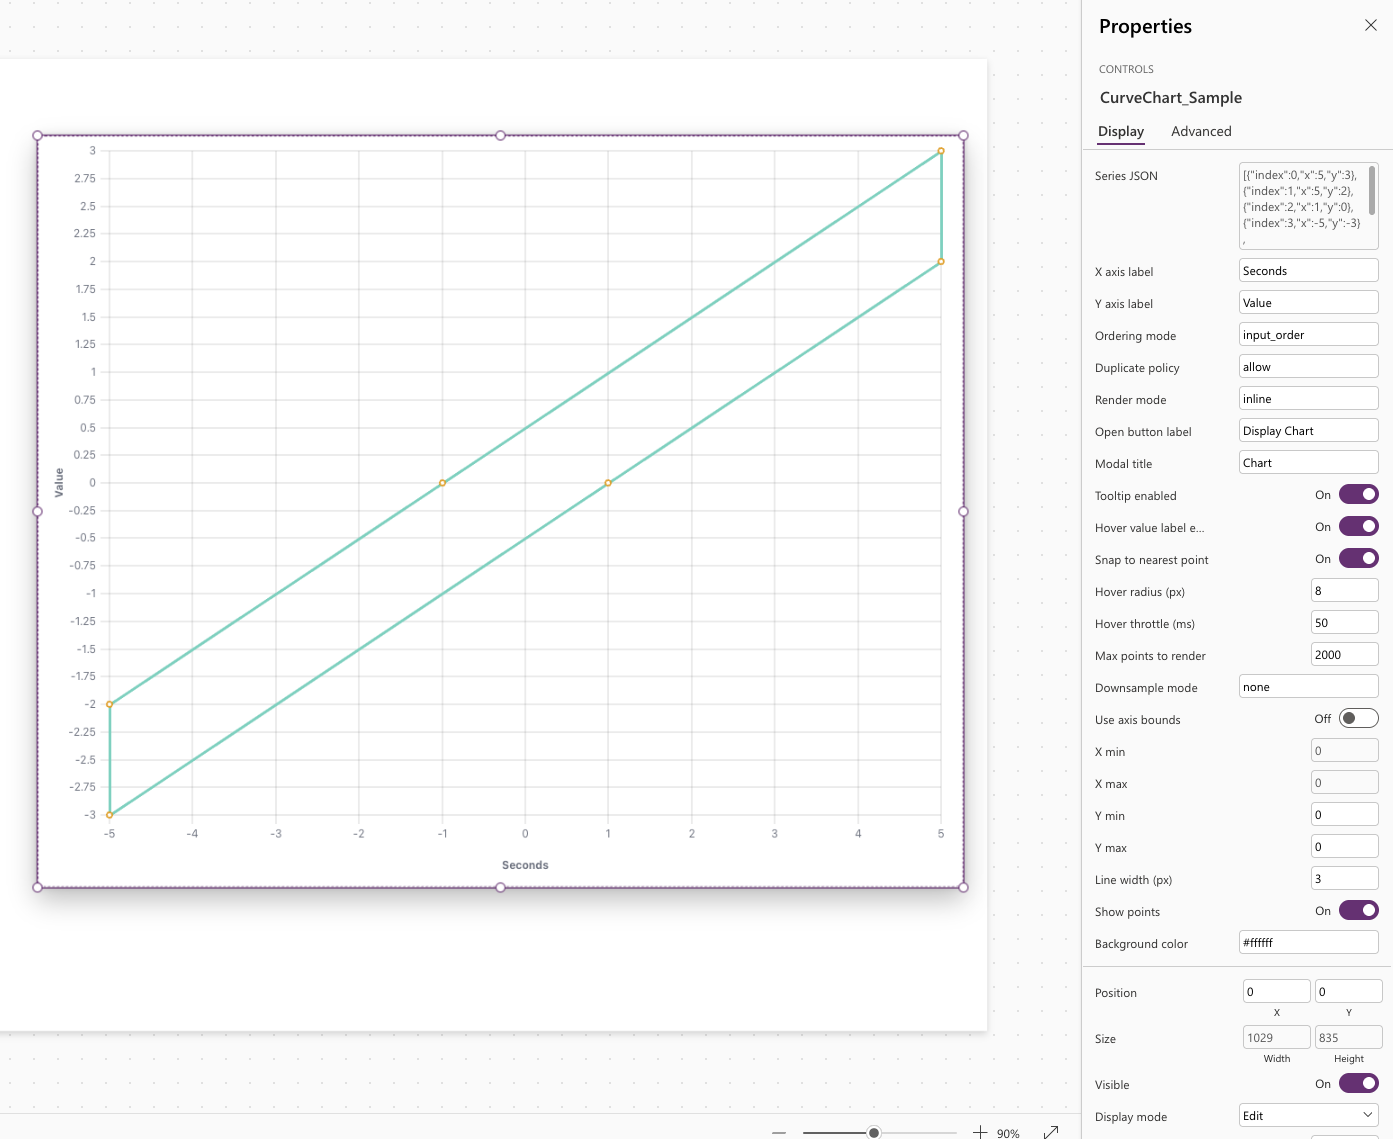
Preserves input order. If index is present, it orders by index. |
x_ascending |
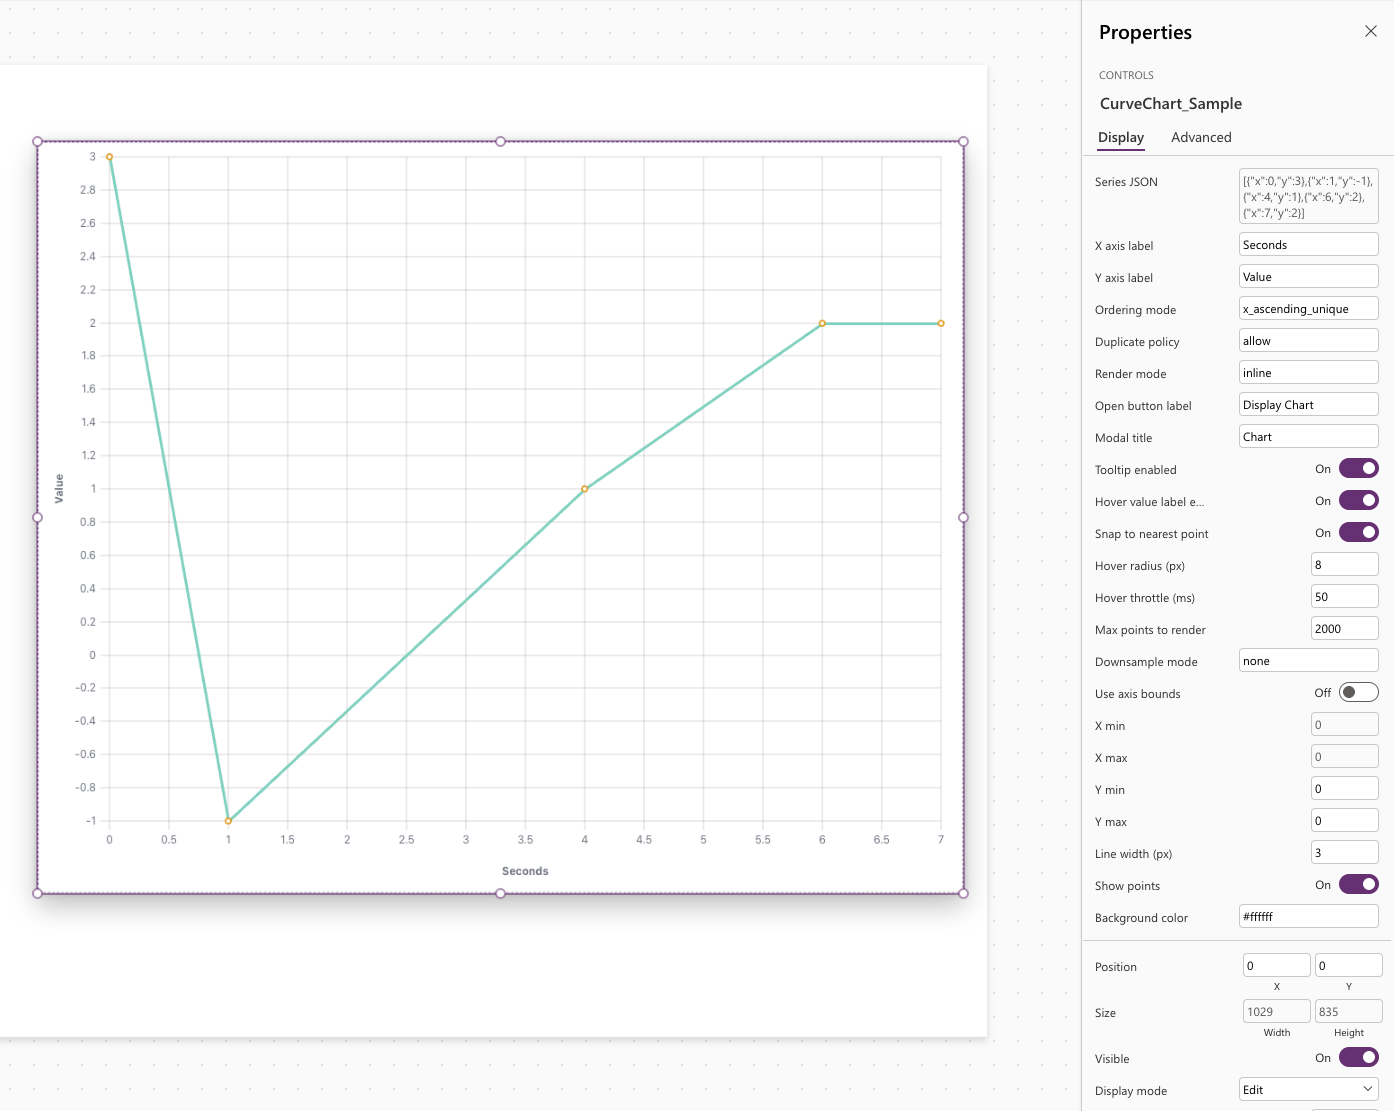
Sorts points by x ascending. |
x_ascending_unique |
Sorts by x and enforces unique x values. |
x_strict |
Requires input to already be strictly increasing by x. |
Duplicate policy (used for sorted modes):
allow: keep duplicateserror: reject duplicateskeep_first: keep first point in each duplicate groupkeep_last: keep last point in each duplicate group
Examples (screenshots)
Example 1: index-driven input order
Example 2: X-ascending output
Events and outputs
Component actions:
onHoverChangedonSelectionChanged
Useful outputs:
- Hover:
hoveredX,hoveredY,hoveredPointIndex,hoveredPointJson - Selection:
selectedX,selectedY,selectedPointIndex,selectedPointJson
Example:
// CurveChart1.onSelectionChanged
Set(varSelectedPointJson, CurveChart1.selectedPointJson);

// CurveChart1.onHoverChanged
Set(varHoveredPointJson, CurveChart1.hoveredPointJson);
Troubleshooting (fast)
Invalid mode '...': useinput_order,x_ascending,x_ascending_unique, orx_strict.Invalid duplicatePolicy '...': useallow,error,keep_first, orkeep_last.- Empty chart: ensure every point has finite numeric
xandy. x_strictvalidation error: sort first or switch tox_ascending.
Links
- GitHub repository: Just-Boring-Cat/cardinal-chart-pcf
- PCF Gallery: publish target is
https://pcf.gallery/(this guide will be updated once the listing is live)